
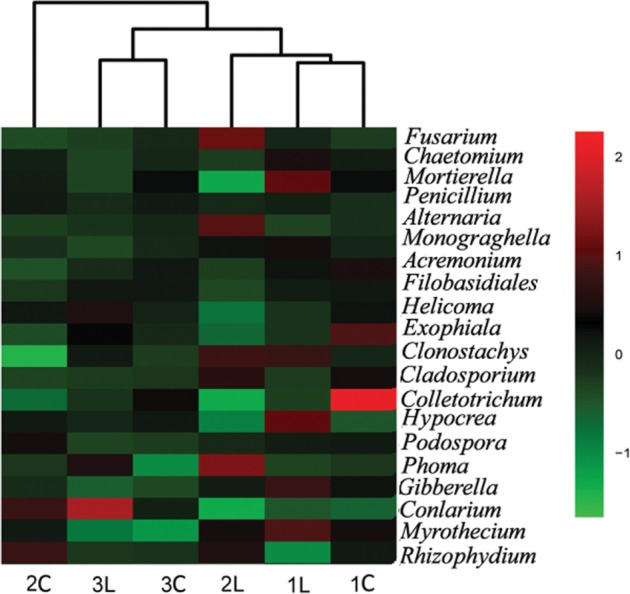
Fig. 4. Heatmap displaying the relative abundances of the greatest 20 genera (> 0.1%), using the soft R (pheatmap).
Official websites use .gov
A
.gov website belongs to an official
government organization in the United States.
Secure .gov websites use HTTPS
A lock (
) or https:// means you've safely
connected to the .gov website. Share sensitive
information only on official, secure websites.