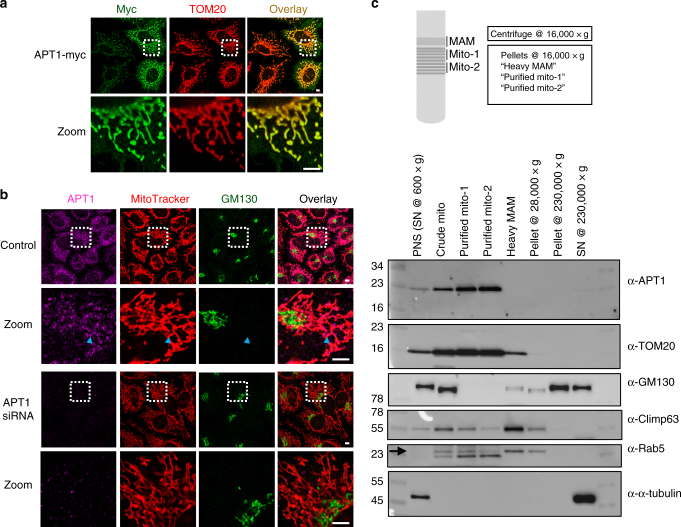
Fig. 7.
Immunostaining and subcellular fractionation experiments reveal APT1 is localized in mitochondria. a Immunostaining of HeLa cells overexpressing APT1 with a myc tag reveals APT1 localized to mitochondria. 5 µm scale bars shown. b Immunostaining of endogenous APT1 in HeLa cells confirms APT1 is predominantly localized in mitochondria mitochondria (e.g., co-localization pointed by the blue arrows). Knockdown of APT1 by RNAi confirms that the measured signal is due to APT1. 5 µm scale bars shown. c HeLa cells were fractionated to isolate mitochondria by means of differential centrifugation and a continuous Percoll gradient63 (Supplementary Fig. 23). Fractions recovered at different steps of the protocol were loaded in an SDS-polyacrylamide gel (10 µg of total protein per lane) and analyzed by western blot. The fractions that are highly enriched for mitochondria (high Tom20, low alpha-tubulin and GM130) display the highest levels of APT1, confirming the immunostaining experiments and demonstrating APT1 is predominantly localized in mitochondria. In the anti-Rab5 panel, the upper bands (arrow) correspond to Rab5. The lower bands in this panel correspond to Tom20 staining since the nitrocellulose membrane used for Tom20 staining was reblotted with anti-rab5 antibody. Similar enrichment patterns were observed for all antibodies in at least four independent fractionation experiments. Numbers on the left indicate protein sizes of the corresponding bands of the molecular weight marker (first lane). PNS post-nuclear supernatant, MAM mitochondria-associated ER membranes, SN supernatant. Original uncropped blots are provided in Supplementary Fig. 24

