
Fig. 8.
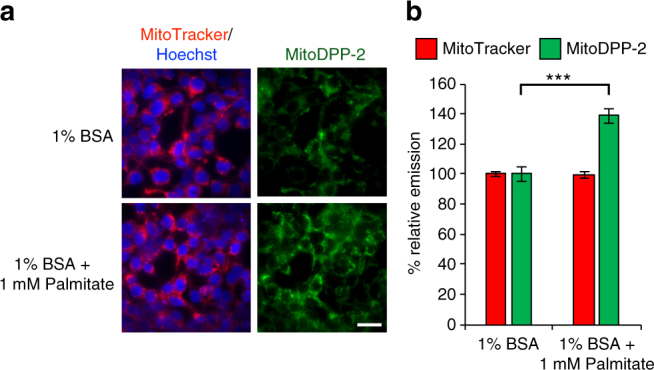
Palmitate activates mitochondrial S-deacylase activity. a HEK293T cells were treated for 6 h with 1% BSA ± 1 mM palmitate post-starvation (6 h), followed by treatment with 1 µM Hoechst 33342, 100 nM MitoTracker Deep Red for 30 min, washed, loaded with 500 nM mitoDPP-2 for 10 min, and then analyzed by fluorescence microscopy. 20 µm scale bar shown. b Quantification of the relative fluorescence intensity from mitoDPP-2 and MitoTracker in 1% BSA ± 1 mM palmitate-treated cells from (a). Statistical analyses performed with a two-tailed Student′s t-test with unequal variance, **P value < 0.0005, n = 6 for (b), error bars are ± s.e.m