Figure 7.

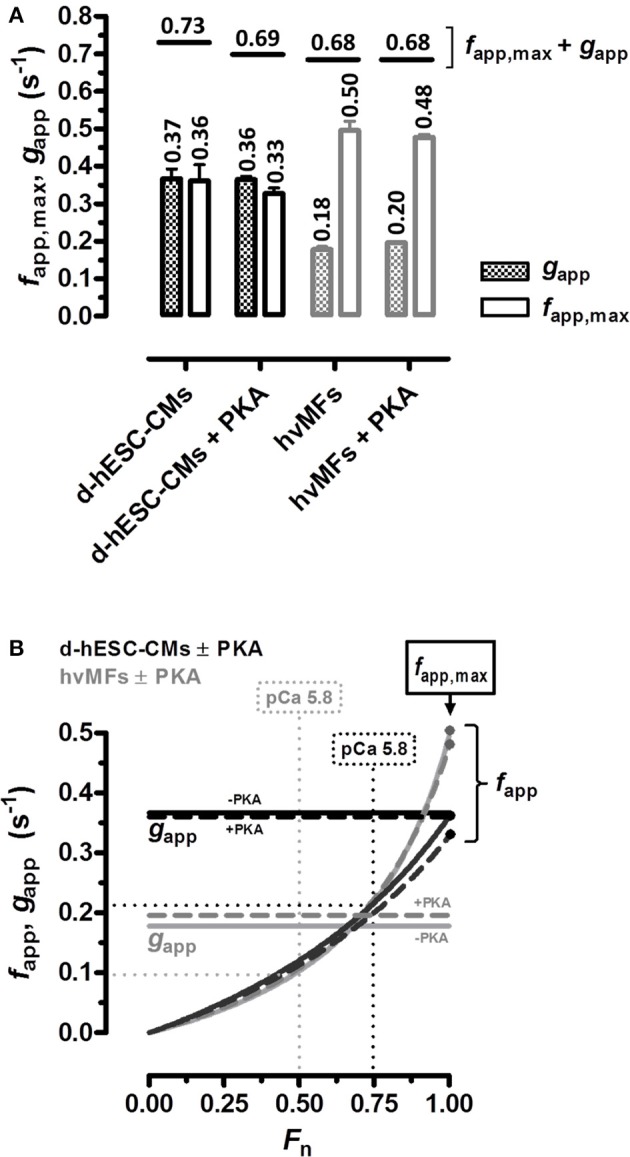
(A) kTR vs. Fn data (plotted in Figure 3) was fitted to the equation given in the legend of Figure 3 and yielded the cross-bridge kinetics-related predicted parameters gapp (patterned bars) and fapp,max at Fn = 1 (open bars) for d-hESC-CMs (black bars) and for hvMFs (gray bars) which were either treated or not with PKA. Horizontal short lines correspond to the sum fapp,max + gapp predicting kTR at saturating [Ca2+] (pCa 4.18). Numbers, mean values. Error bars, standard errors (SE). (B) From all four curves (black, d-hESC-CMs; gray, hvMFs; solid, −PKA; dashed, +PKA) fitting kTR vs. Fn data shown in Figure 3, fapp was calculated by subtracting the predicted gapp values given in A and then plotted against Fn (0 < Fn ≤ 1). gapp is Ca2+-independent (horizontal lines); fapp was positive, monotonically increasing from zero (Fn = 0) to fapp,max (Fn = 1) (Brenner, 1988).
