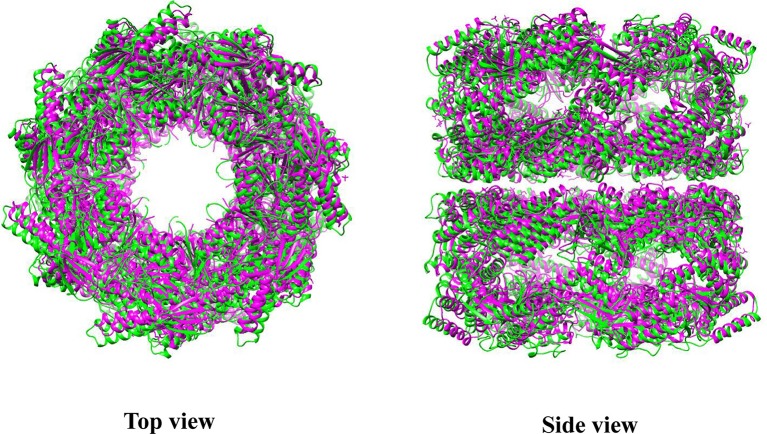
Figure 3.
Superposition of CrCpn60β1 with GroEL. Green represents CrCpn60β1 and magenta represents GroEL. The molecular structure was generated by UCSF Chimera (Pettersen et al., 2004) using CrCpn60β1 coordinates 5CDI and GroEL coordinates 1XCK from Protein Data Bank.

