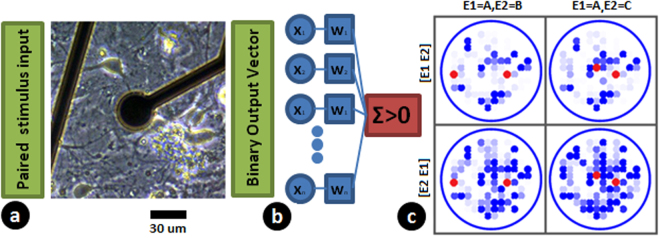
Figure 2.
Experimental setup and data. (a) Neuronal culture grown on multi-electrode array used for studying conjunctive binding of inputs. (b) Responses from the culture converted to binary vectors and perceptron decoders trained to classify patterns. (c) Different response patterns on the multi electrode being created when a pair of electrodes (highlighted in red) are stimulated with a delay of 0.5 ms between stimuli. Each blue dot represents an output electrode and the intensity of the dot shows the probability of observing a spike within a 100 ms time window post stimulus. A particular paired stimulus was repeated 45 times to calculate the probability of observing the spike. One can see that the pattern depends on the electrodes being stimulated and order of stimulation.

