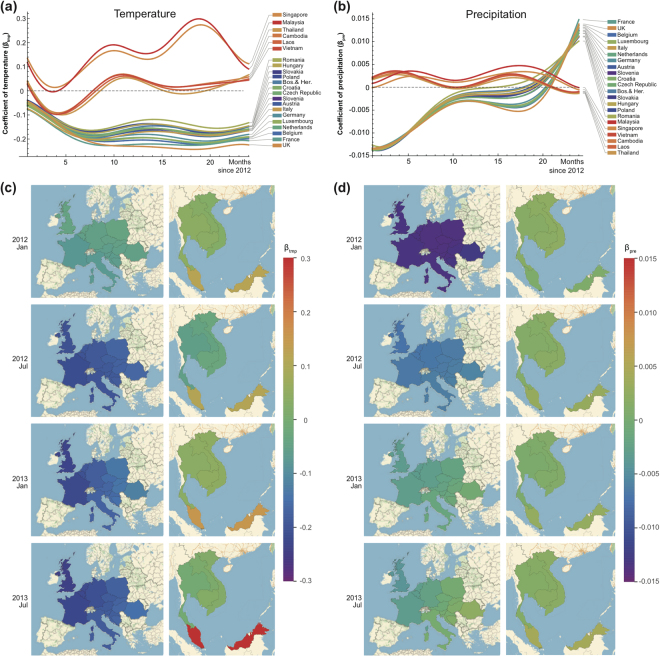
Figure 5.
Regression coefficients (β) estimates for temperature and precipitation in Europe and Southeast Asia. Through-time regression coefficient estimates of temperature (βtmp; panel a) and precipitation (βpre; panel b) for 22 countries. Maps of the coefficients of temperature (βtmp) in European and Southeast Asian regions in January 2012, July 2012, January 2013 and July 2013 are shown in panel c. Maps for the precipitation coefficients (βpre) are shown in panel d. The color bars are showing the magnitude scales for panel c,d. The results of relative humidity are omitted because their confidence intervals are wide and cover zero, and thus indicate no significant correlation. The maps were created using Mathematica (version: 11, https://www.wolfram.com/mathematica/).

