Figure 1.
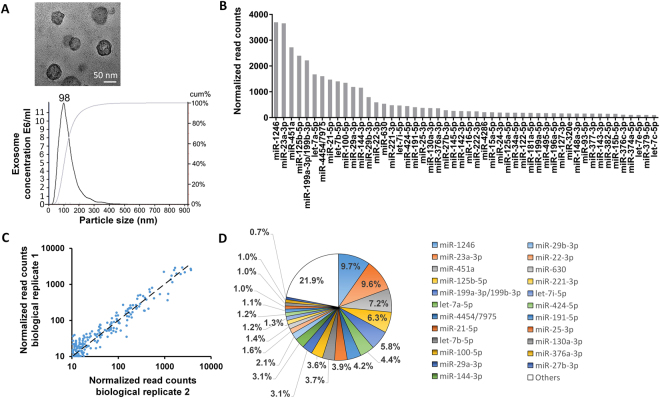
(A) TEM image of MSC exosomes and analysis of exosome size by nanoparticle tracking analysis. (B) Total reads of the top 50 miRNAs are shown. All miRNAs were normalized to positive and negative controls. miRNA profiling was performed using the NanoString platform and analyzed with nSolver Software 3. (C) Correlation of biological replicates of miRNA read counts of MSC exosomes. The Pearson correlation coefficient is 0.93. (D) The top 23 miRNAs account for 79.1% of total miRNAs present in MSC exosomes.

