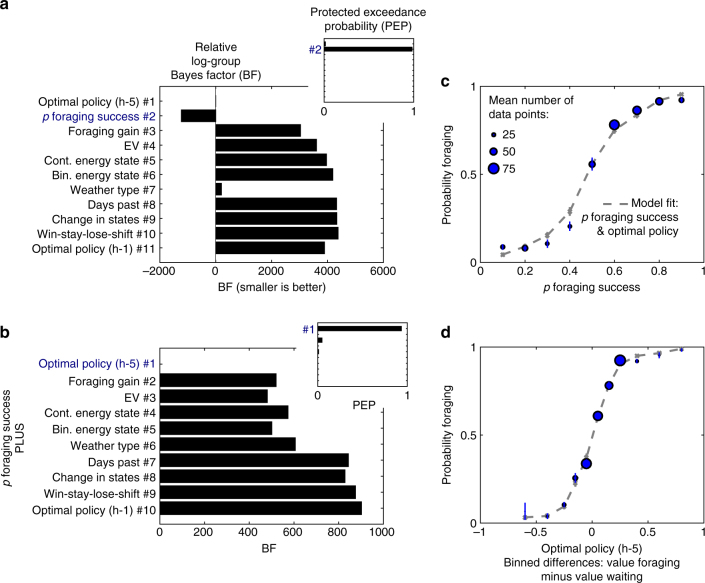
Fig. 3.
Choice data and models of the fMRI sample. a Model comparisons show that the probability of foraging success was the best single predictor of participants’ behavior. Main plots depict fixed-effects analyses using log-group Bayes factors based on Bayesian Information Criterion (BIC) relative to model #1. Insets show random-effects analyses using protected exceedance probabilities (PEP) with the winning model marked. See Table 1 and Table 2 for lists that specify the task variables and thus the models tested here. b Crucially, the a priori optimal policy according to a time horizon of five days best explained the remaining variance in participants’ choices. c The winning model, which includes the probability of foraging success and the optimal policy, captures the empirical relationship between participants’ average choices and the probability of foraging success. d The winning model captures the relationship between participants’ average choices and the optimal policy according to a horizon of five days (binned value differences of foraging vs. waiting). In the left-hand panels, blue font denotes the winning models. In the right-hand panels, error bars are SEM. Per data bin, circles depict mean empirical data points and lines and crosses depict mean model predictions (averaged for simulated data according to each participant’s model fit). In several cases, error bars are smaller than the circles, which scale with the average number of trials contributing to the respective data points. See Supplementary Fig. 3 for the behavioral sample. See Supplementary Tables 1–4 for model comparisons. h-5: horizon of 5 days; h-1: horizon of 1 day; cont.: continuous; bin.: binary

