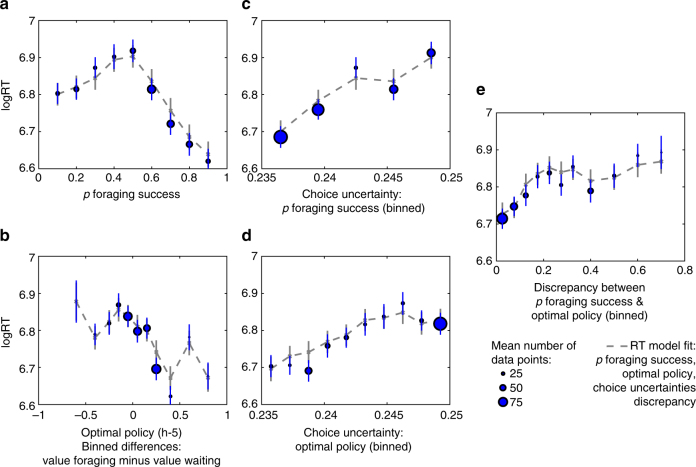
Fig. 5.
Reaction time data and models of the fMRI sample. We tested the relationship between RTs and variables associated with the heuristic and optimal policies. Since the probability of foraging success emerged as the best predictor of participants’ choices, we only included this but not any other heuristic in the model of RT data. RTs relate to a the probability of foraging success and also weakly to b the optimal policy. Importantly, RTs become slower with c, d increasing choice uncertainties of these two variables and e higher discrepancies in their prescriptions. Posterior predictive checks show that RT data were well captured by a model that includes the five depicted variables. Error bars are SEM. Per data bin, circles depict mean empirical data points and lines and crosses depict mean model predictions (averaged for simulated data according to each participant’s model fit). Circles scale with the average number of trials contributing to the respective data points. See Supplementary Fig. 13 for the behavioral sample, Supplementary Fig. 6 for the parameter estimates of the full RT model, and Supplementary Fig. 7 for posterior predictive checks of the RT model with data split differently. See Supplementary Table 6 for statistical inferences obtained from a linear mixed effects model

