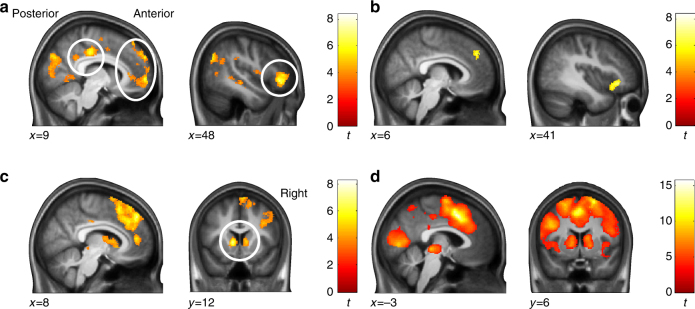
Fig. 7.
BOLD signals related to choice uncertainties, discrepancies, and RTs during the choice phase. a Choice uncertainty of the heuristic (i.e., probability of foraging success) showed a negative relation with BOLD signals in VMPFC (peak voxel: x;y;z(MNI) = 9; 59; −2; t = 6.24), DMPFC (x;y;z(MNI) = 3; 56; 33; t = 4.50), IFG (x;y;z(MNI) = 48; 35; −5; t = 7.37), and the posterior cingulate cortex (x;y;z(MNI) = 15; −27; 39; t = 7.63), among other regions. b Choice uncertainty of the optimal policy exhibited a negative correlation with DMPFC/ACC (x;y;z(MNI) = 6; 42; 38; t = 4.81) and IFG (x;y;z(MNI) = 48; 26; −9; t = 5.88). c Discrepancies between the two policies showed a positive relation with DMPFC (extending into pre-SMA and ACC; x;y;z(MNI) = −9; 36; 38; t = 8.25), bilateral dorsal striatum (left: x;y;z(MNI) = −11; 12; 3; t = 7.16; right: x;y;z(MNI) = 11; 20; −3; t = 7.66), and bilateral IFG (left: x;y;z(MNI) = −30; 26; −5; t = 6.17; right: x;y;z(MNI) = 50; 26; −11; t = 6.85). d For completeness, (positive) correlations with log-transformed RTs are depicted. Overlay on group average T1-weighted image in MNI space; clusters are whole-brain FWE corrected for multiple comparisons at p < 0.05 with a cluster-defining threshold of p < 0.001. Color bars depict t-values. See Supplementary Table 7 for a list of all clusters (as well as Supplementary Tables 8–10; Supplementary Fig. 14; and Supplementary Fig. 15 for further analyses of the choice phase). See Supplementary Table 11 and Supplementary Fig. 16 for BOLD signals during the outcome phase

