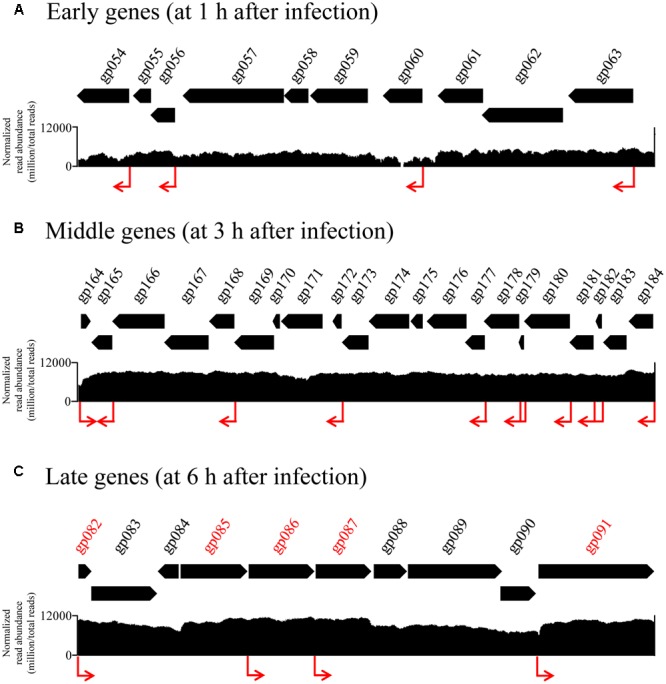
FIGURE 5.

Transcriptomic read mapping pattern of early, middle, and late genes. Part of genome-wide overview of reads mapped to the Ma-LMM01 genome at samples taken 1 h (A), 3 h (B), and 6 h (C) after infection, which are composed of early, middle, late genes respectively. Genes shown in red represent the viral late genes (C). The visualization analyses for each time point were conducted independently. Read abundance was normalized by Integrative Genomics Viewer function (million per total read count). Red arrows indicate the position of predicted early, middle, and late promoter sequence in silico analysis.
