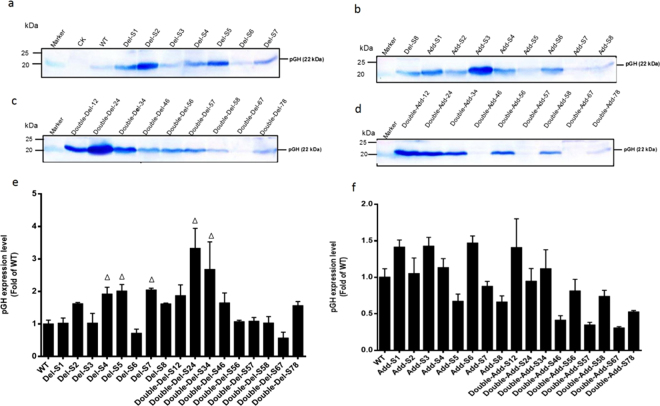
Figure 2.
Western blots of pGH protein from strains contained PAOX1 variants. For detection of pGH, 50 μg intracellular proteins were used for SDS-PAGE while Rabbit anti-pGH polyclonal antibody was used for Western blot. The pGH expression level in poly(dA:dT) tracts deletion variants were shown in Lane 3–9 (a), Lane 1 (b) and Lane 1–9 (c); The pGH expression level in addition variants were shown in Lane 2–9 (b) and Lane 1–9 (d). CK represented negative control samples from pPICZA transformant; WT represented the pGH expression level from strain harboring wild-type AOX1 promoter. The relative expression levels of pGH in all strains were quantified with ImageJ software. WT was chosen as the standard sample to perform relative comparison. The integrated density of each band represented the abundance of protein. The results of three independent cultivations were indicated as mean ± SD. The relative expression level of pGH in deletion variants were shown in e and addition variants in f.

