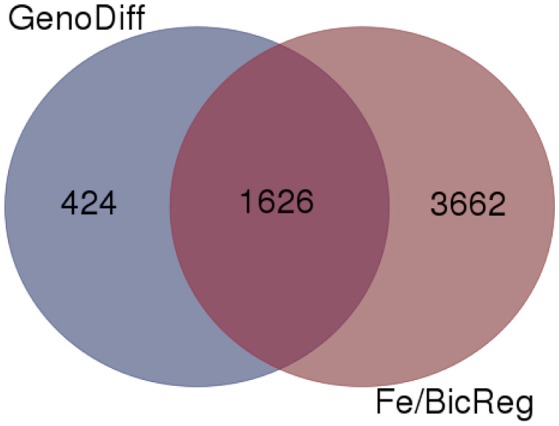
Figure 6.

Venn diagram comparing genes with differential expression in a specific condition (low or normal Fe supply with 0, 2.5, or 5 mM bicarbonate) between IDC sensitive and tolerant lines (GenoDiff) to genes that responded to low Fe and/or bicarbonate in either line (Fe/BicReg). The 1,626 overlapping genes are featured in Supplementary Table 4.
