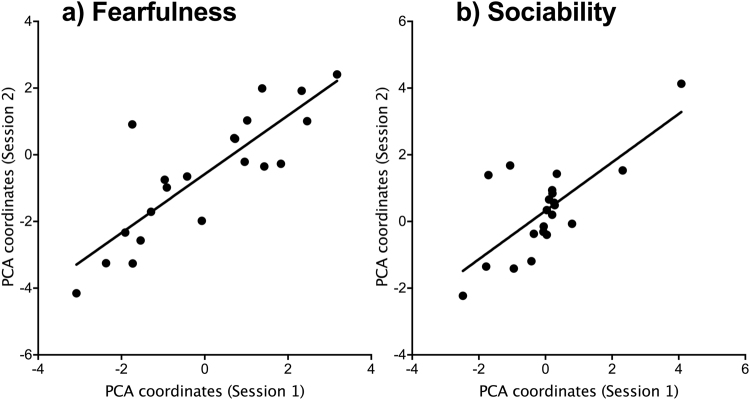
Figure 4.
Consistency over time for (a) Fearfulness and (b) Sociability dimensions. Principal component analyses were performed using averages of similar behaviors expressed in the four tests. Individual coordinates for Session 2 were calculated using the function predict.PCA that keeps the same space created for Session 1. Individual coordinates on each component of each PCA were used (n = 21 calves). More positive values mean that calves were either more fearful (slower to make contact with the novel object and the unfamiliar human) or more sociable (high number of vocalizations and short latency to reach the herd).

