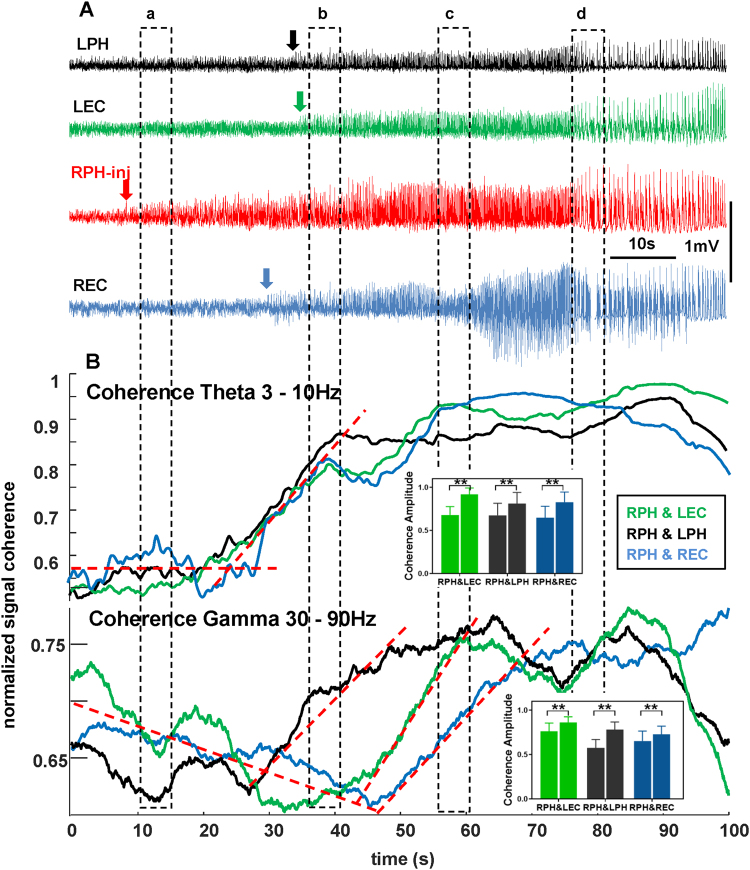
Figure 3.
Recruitment of brain areas into the seizure activity after intrahippocampal kainic acid injection. (A) Raw data with indication of seizure occurrence in the right posterior hippocampus (RPH-inj – red arrow), in the right entorhinal cortex (REC – blue arrow) as well as in the left posterior hippocampus (LPH – black arrow) and entorhinal cortex (LEC – green arrow). (B) Coherence for theta (top) and gamma (bottom) frequency bands during recruitment of different brain areas into the seizure activity. Dashed lines indicate slopes of coherence changes for each frequency band.

