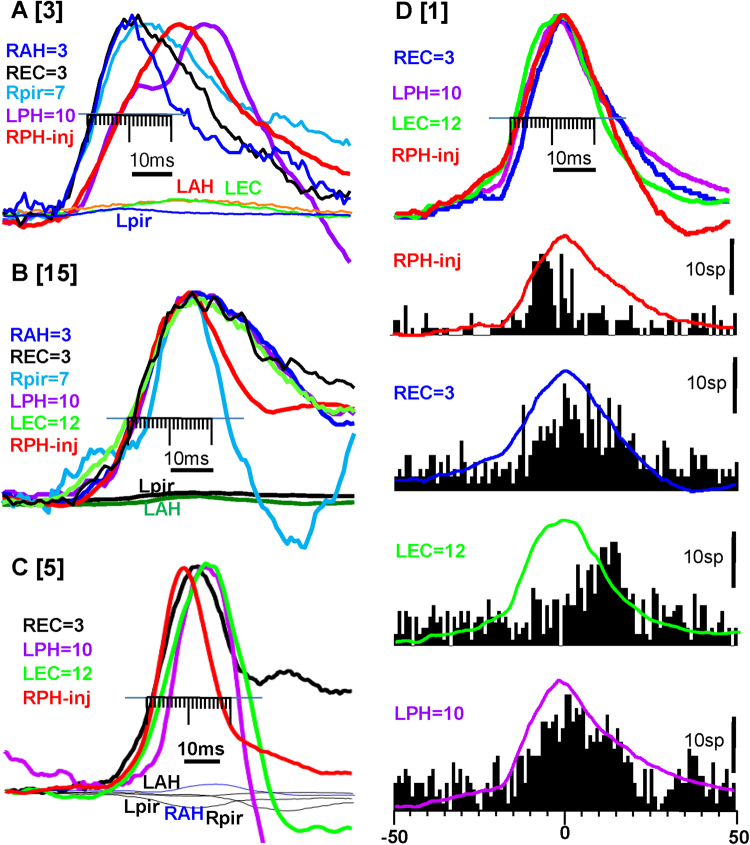
Figure 5.
The time difference between epileptiform events recorded in the area of injection (red line) and other brain areas after injection of kainic acid in 3 different rats (A–C) [numbers in square brackets are identical with the rat number in the Table 2]. The average of the first 10 epileptiform events from the seizure onset normalized by amplitude are presented in each graph. The areas which show epileptiform events are indicated on the left of each graph and color matched to the lines in the graph. The numbers indicate the physical distance between the recorded site and the injection site in mm. The minor division on the scale is 1ms. Shaded lines indicate SD Abbreviations are the same as on the Fig. 2D. Correlation of multiunit discharges and LFP during seizure development after kainic acid injection. The top lines are LFPs for each recorded brain area and below are perievent histograms referenced to the peak of LFP recorded in the injection area.

