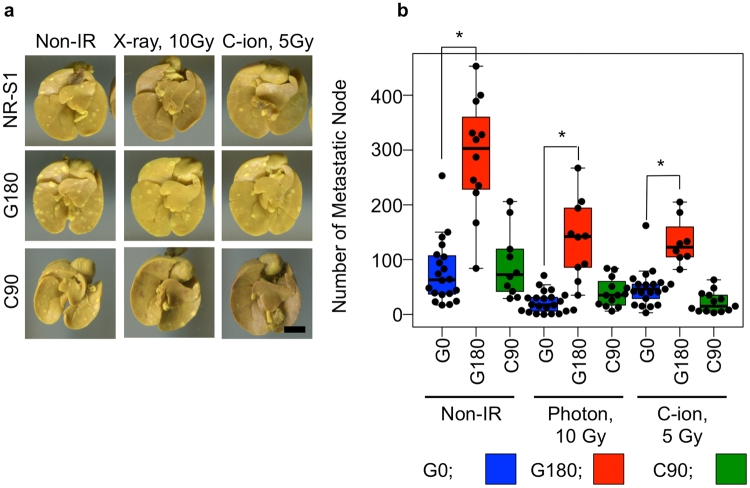
Figure 3.
Metastatic potential. (a) shows the basal part of the lung with metastatic nodule. The scale bar showing in the right bottom panel indicates 5 mm, and this scale is able to be applied in all photographs. (b) shows summary of the values. The plots indicate the number of metastatic nodule of each tumor-bearing mouse. The top and bottom side of the boxes are 25 and 75 percentile. The upper and lower whiskers are maximum and minimum value. If the maximum number of the nodules is more than the1.5-times interquartile range, the value is regarded as the outliers. The horizontal bar in each box is median value.

