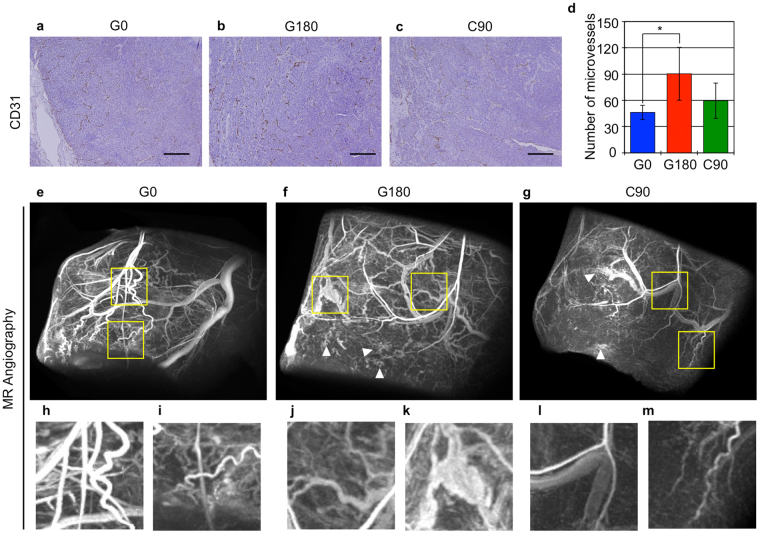
Figure 5.
Evaluation of tumor microvessels using immunohistochemical staining and magnetic resonance angiography. (a–c) show the tissue section immunostaining with anti-CD31 antibody. The scale bar shows 250 µm. (d) shows the number of CD31 positive microvessels in each tumor. The values indicated the mean ± standard deviation. The asterisk means statistical significant compared with the value of G0 tumor. (e–m) Shows 3D MR micro-angiography of the indicated tumor. (h,i), (j,k) and (l,m) were indicated that the magnified images of the area enclosing yellow square in (e), (f) and (g), respectively.

