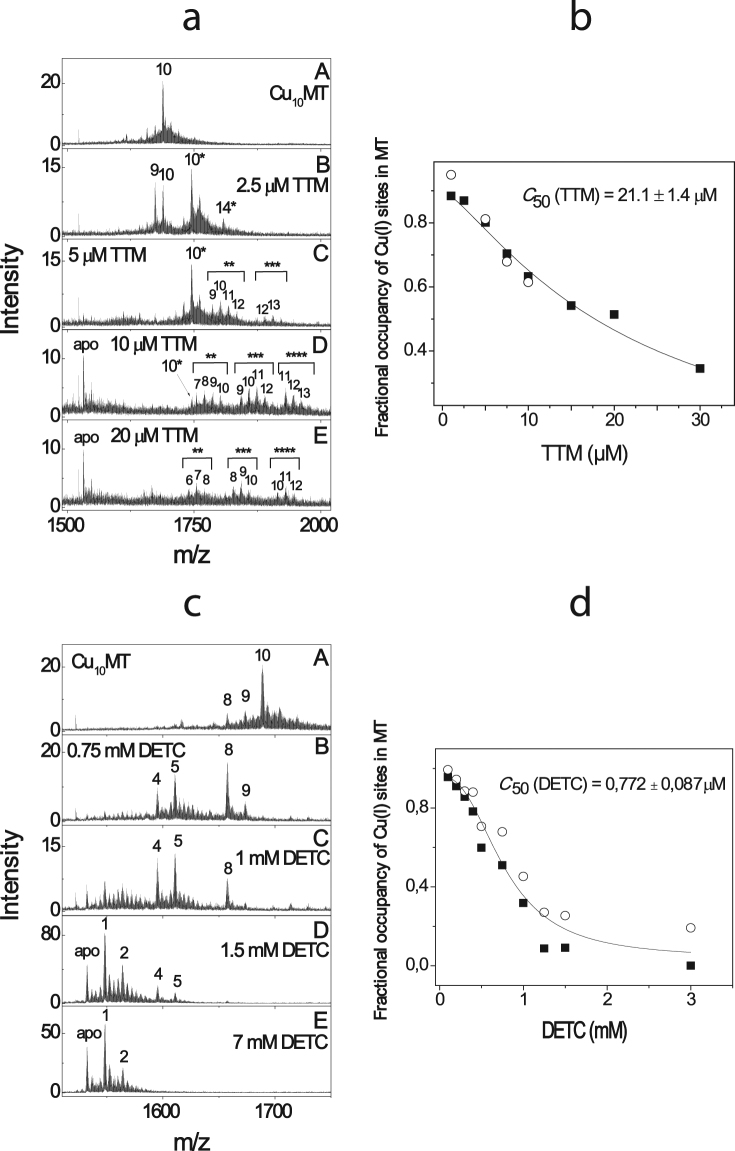
Figure 2.
Determination of the relative Cu(I)-binding affinity of TTM and DETC in competition with Cu10MT. ESI-MS spectra of Cu10MT in the presence of 1 μM–20 μM TTM (a) and 0.1–7 mM DETC (c). Conditions: MT 3 μM; 20 mM ammonium acetate, pH = 7.3, DTT 10 mM; T = 25 °C. Ions with a charge state + 5 are shown; numbers on the peaks denote the metal stoichiometry of the complex. Number of asterisks denotes number of TTM molecules in the complex. Fractional occupancy of Cu(I)-binding sites in MT at different concentrations of TTM (b) and DETC (d) in a metal competition experiment. Results of duplicate experiments are presented with different symbols. The solid line shows the fitting curve with Hill equation (y = START + (END − START) * x^n / (K^n + x^n)), where K = C50.

