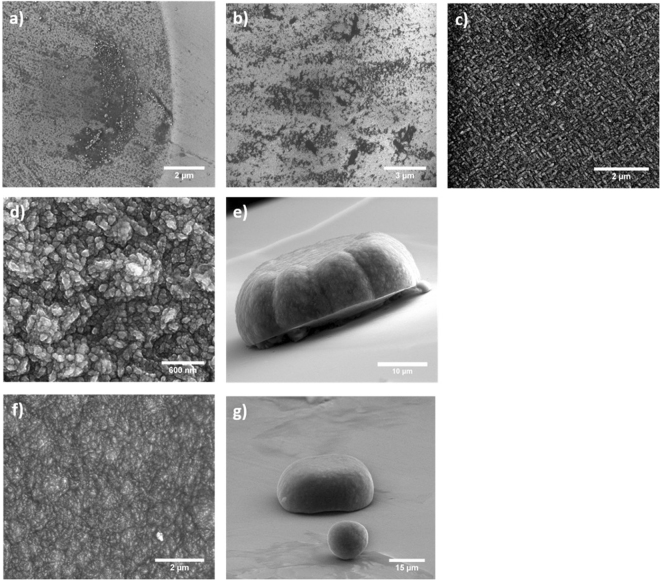
Figure 1.
SEM images of the various growth experiments shown at different magnifications to give a broad perspective of nuclei density and coverage of the SCD surface. Growth experiments are depicted as follows: (a) 1 minute (b) 3 minutes, dark regions are SCD areas without NCD growth. (c) 15 minutes showing uniform coverage (d) 3 hours (e) 3 hour side view showing growth only in the region defined by tungsten mask (f) 6 hours (g) 6 hour side view showing a satellite spherical NCD growth in addition to central second stage defined by tungsten mask.

