Figure 1.
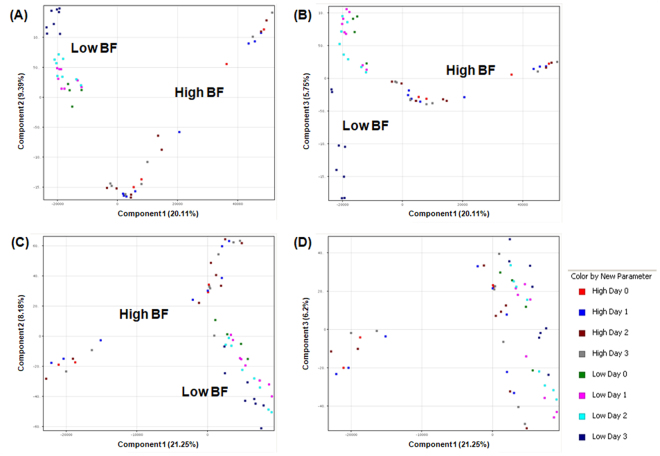
Two-dimensional principal component analysis (PCA) of 56 samples based on global metabolomic profiles. The PCAs were generated using MassHunter Mass Profiler Professional (MPP) software. There were 28 low and 28 high biofilm-forming samples. Independent replicates are available for Day 1 to 3 samples. Axes represent the principle components of the PCA and the numbers indicate the percentage of variance that is captured by each component. H. pylori strains formed distinct clusters on the basis of features acquired in positive ionization mode using (A) components 1 (20.11%) and 2 (9.39%), and components 1 (20.11%) and 3 (5.75%) (B). H. pylori strains formed distinct clusters on the basis of molecular features acquired in negative ion mode using components 1 (21.25%) and 2 (8.18%) (C) but not when components 1 (21.25%) and 3 (6.2%) was used (D). The scores shown by the axes scales are used to check data quality.

