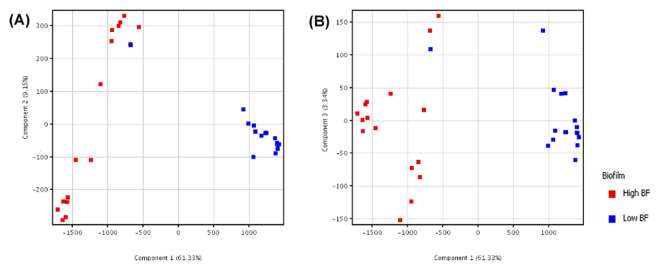
Figure 2.
Two-dimensional principal component analysis (PCA) based on 351 significantly different metabolites. The PCAs were generated using MPP. Legend: red (high biofilm-formers, N = 28) and blue (low biofilm-formers, N = 28). Independent replicates are available for Day 1 to 3 samples. Axes represent the first three principle components of the PCA and the numbers indicate the percentage of variance that is captured by each component. (A) Shows the H. pylori strains separated based on components 1 (61.33%) and 2 (9.15%), while (B) shows the strains separated based components 1 (61.33%) and 3 (3.34%).

