Figure 4.
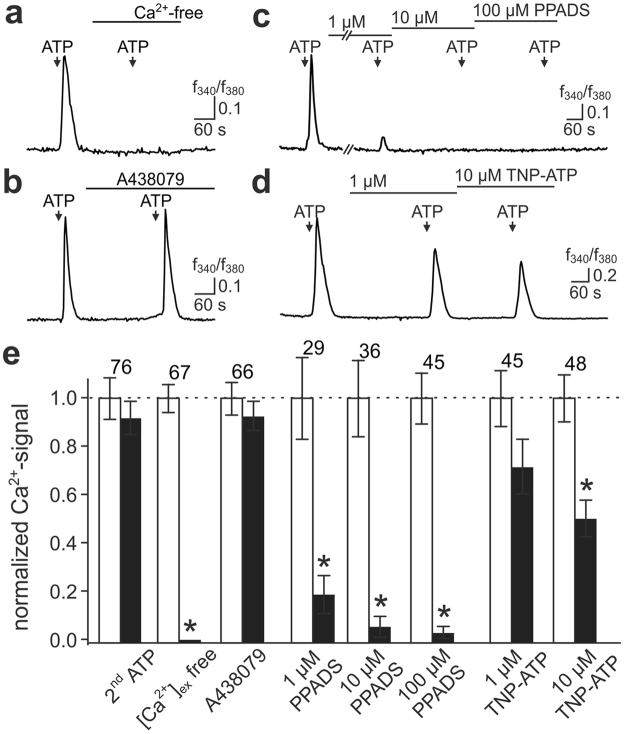
Pharmacological signature of ATP-dependent HTPC Ca2+ signals. (a–d) Representative original traces (f340/f380 versus time) of [Ca2+]c transients recorded from individual HTPCs challenged with ATP (1000 µM (a,b); 30 µM (c,d); 5 s; arrows) under control conditions and during different biophysical/pharmacological treatments. Signals are abolished in absence of external Ca2+ (a), essentially unaffected by the P2RX7 receptor antagonist A438079 (10 µM (b)), and strongly or partly reduced in presence of PPADS (c) or TNP-ATP (d), respectively. Treatment duration (pre-incubation) is indicated by horizontal bars. (e) Bar chart quantifying the effects of different conditions on [Ca2+]c response amplitudes (black bars). Data are means ± SEM, normalized to control conditions (i.e., prior stimulation; white bars). Numbers of cells are indicated above bars. Asterisks (*) denote statistical significance, p < 0.05 (paired t-test).

