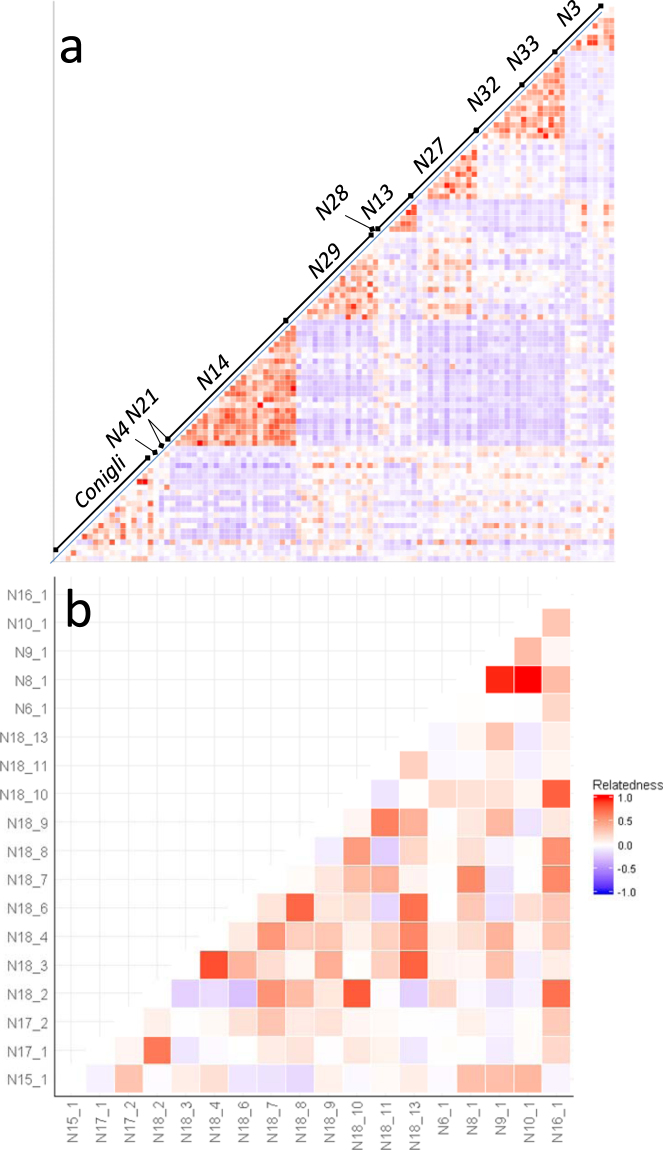
Figure 3.
Heatmap of the relatedness index among sample pairs of the Mediterranean sporadic nests. Each cell represents the value of Lynch & Ritland relatedness index91 among individual samples as plotted in both the y and x axis. Panel a) includes the values of all the possible sample pairs with the samples of each nest indicated in the diagonal. Panel b) includes the values of all the sample pairs of the nests laid in Conigli Beach (Italy).

