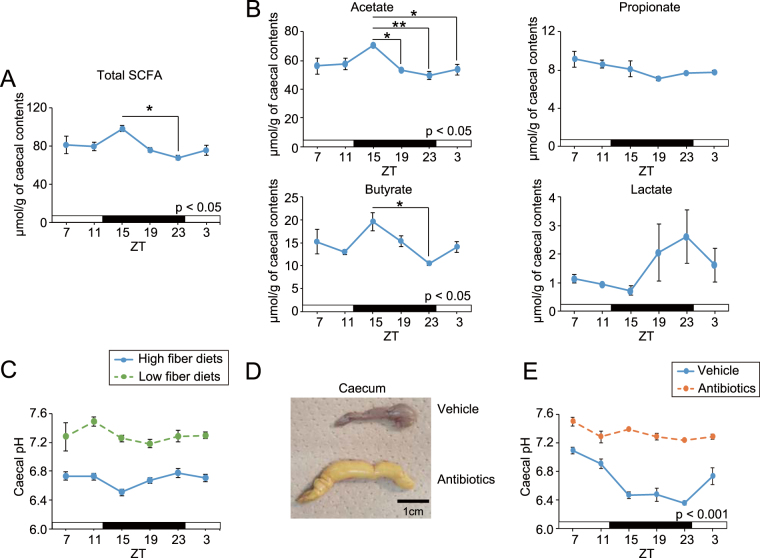
Figure 1.
Daily fluctuations of caecal short chain fatty acid (SCFA), lactate content, and caecal pH in different conditions. (A,B) Caecal total SCFA content (A, acetate, butyrate, and propionate), each SCFA and lactate content (B, n = 3 tubes for SCFA measurement, 3 caecal samples were pooled in 1 tube). (C) Caecal pH was measured every 4 hours over 24 hours in ICR mice in ad libitum with high or low fibre diets (n = 10 for high fibre diets, n = 4 for low fibre diets in each time point). (D,E) Caecal picture (D) and pH (E) from vehicle or antibiotic-treated (at least a month by drinking) C57BL mice (n = 4 for each). All values are expressed as mean ± SEM. The P value of the one- or two-way ANOVA is indicated in the lower right side of each graph if significant. *p < 0.05, **p < 0.01, ***p < 0.001 (Tukey’s multiple comparisons test).

