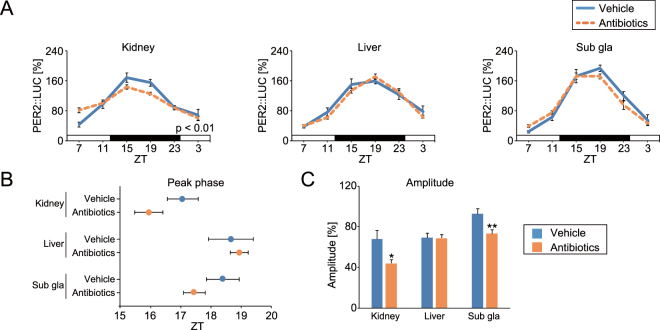
Figure 2.
Effect of antibiotic treatment on peripheral PER2::LUC rhythms. Vehicle (water) or mixed antibiotics was administered to mice in drinking water over a month. (A) Average waveform of in vivo peripheral PER2::LUC imaging in the kidney, liver, and submandibular gland (sub gla). (B,C) Peak phase and amplitude of PER2::LUC rhythms. All the values are expressed as mean ± SEM. The number of mice used in this study is indicated in Table S1. More details on the statistics used is presented in Table S2. *p < 0.05, **p < 0.01, vs. vehicle gavaged group (t-test). P value of the two-way ANOVA is indicated in the lower right side of each graph if significant.

