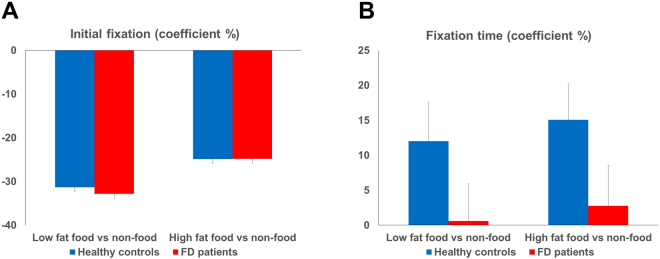
Figure 1.
Coefficient percentage (%) of initial fixation and total fixation time (ms) in FD and healthy controls. Mean and standard error of coefficient % of initial fixation (A) and total fixation duration (B) on low fat food and high fat food images compared to paired non-food images in FD patients and healthy controls. There were no significant differences of initial fixation between groups and images. Total fixation time was significantly lower in FD patients than in HC for both high and low fat food images (P < 0.05).

