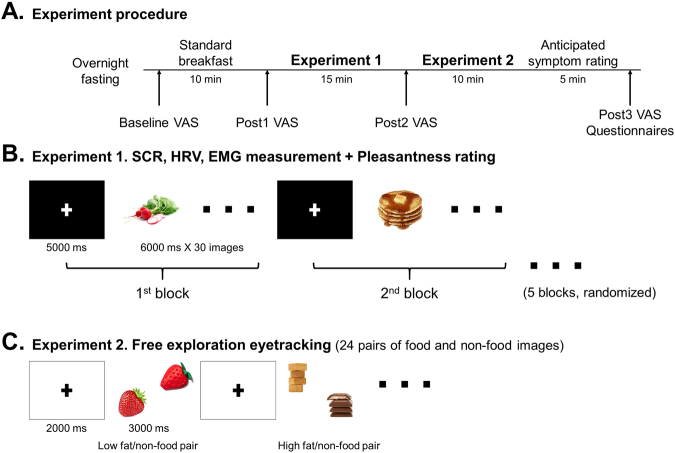
Figure 2.
Experimental protocol. (A) Experimental procedure of the study. (B) Illustration of Experiment 1 including skin conductance response, heart rate, electromyography measurements, and pleasantness rating to food and non-food images. Randomized order of 5 blocks of images (neutral, positive, negative, high fat, and low fat food images, n = 30, 6000 ms for each image) with fixation cross (5000ms) between each block were presented. (C) Schematic presentation of the eye tracking experiment using free exploration paradigm. Low fat food and non-food pairs and high fat food and non-food pairs (n = 12, respectively) were presented for 3000 ms with 2000 ms of fixation cross between pairs. Location of the images (1st–4th quadrant) was balanced.

