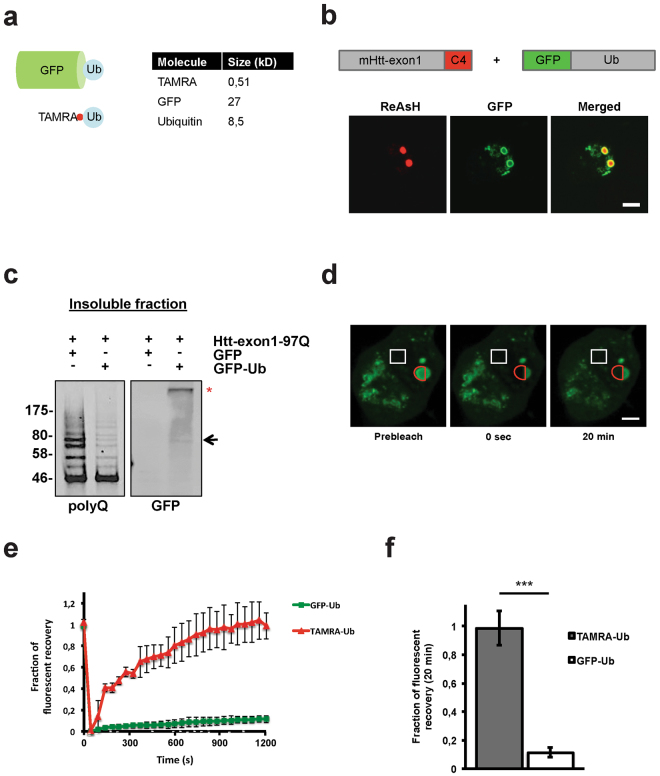
Figure 7.
The action of overexpressed GFP-Ub on mHtt IBs is not equivalent to TAMRA-Ub. (a) Scheme of GFP-Ub versus TAMRA-Ub. (b) Confocal images of transient transfected Neuro-2A cells co-expressing Htt-exon1-97Q-C4 and GFP-Ub. 48 hours after transfection cells were ReAsH-stained and fixed for imaging. Scale bar: 5 µm. (c) Insoluble fraction of Neuro-2A cell lysate 48 hours after transient co-transfection of cells with Htt-exon1-97Q and either GFP or GFP-Ub. Formic acid-dissolved aggregates were loaded on a SDS-PAGE and immunoblotted with the antibodies anti-polyQ and anti-GFP. A band of the size of mono-ubiquitinated GFP-Ub-mHtt was detected (arrow) next to GFP-Ub in a high molecular range (asterisk). (d) FRAP analysis of GFP-Ub in cytoplasmic IBs of Neuro-2A cells 48 hours after transfection. Fluorescence recovery of GFP-Ub on cytoplasmic Htt IBs was measured over time. Red semi-circle indicates where bleaching was directed. White rectangle indicates non-bleached area used as a control for photobleaching and normalization. Scale bar: 5 µm. (e) Analysis of fluorescent recovery in bleached areas of Htt IBs indicates a higher mobility of TAMRA-Ub versus GFP-Ub over time. (f) Quantitative analysis reveals a significantly higher fluorescent recovery of TAMRA-Ub compared to GFP-Ub 20 min after photobleaching. ***p < 0.001. Means and SD are shown.

