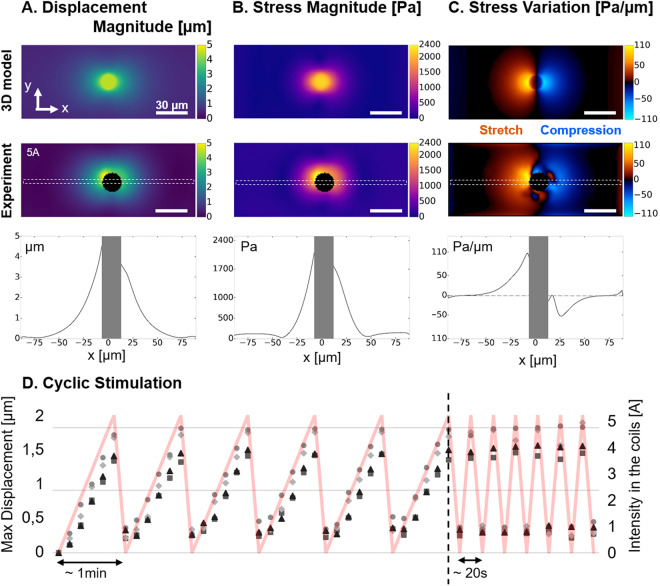
Figure 4.
Actuation of the substrate. (A) The magnitude of displacement induced by a pillar positioned 1 mm away from the electromagnet and experiencing Bx = 119mT and Bz = 27mT was estimated with a 3D model and compared to the magnitude of displacement measured experimentally around 5 pillars stimulated by an electromagnet supplied with 5 A. (B) Maps of stress magnitude were derived from the displacement fields by Fourier Transform Traction Cytometry, and (C) maps of stress variation were calculated to distinguish the regions under traction and compression. Scale bar: 30 µm. Profiles corresponding to the dashed region of each map are also displayed. (D) Maximum magnitude of displacement measured on 4 different pillars undergoing cyclic stimulations applied by manually adjusting the intensity of the current input (red curve).

