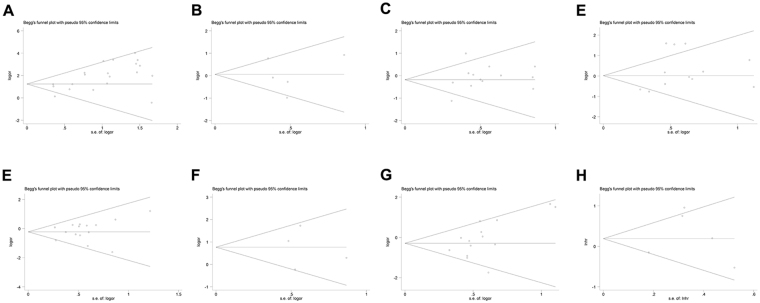
Figure 7.
Begg’s funnel plot analyses to assess the publication bias between MGMT methylation and different NSCLC clinicopathological characteristics; (A) Overall funnel plot from pooled 20 studies, (B) Funnel plot based on age, (C) Funnel plot based on sex status, (D) Funnel plot based on smoking status, (E) Funnel plot based on pathological types, (F) Funnel plot based on differentiation status, (G) Funnel plot based on clinical stage status, and (H) Funnel plot based on NSCLC overall survival.

