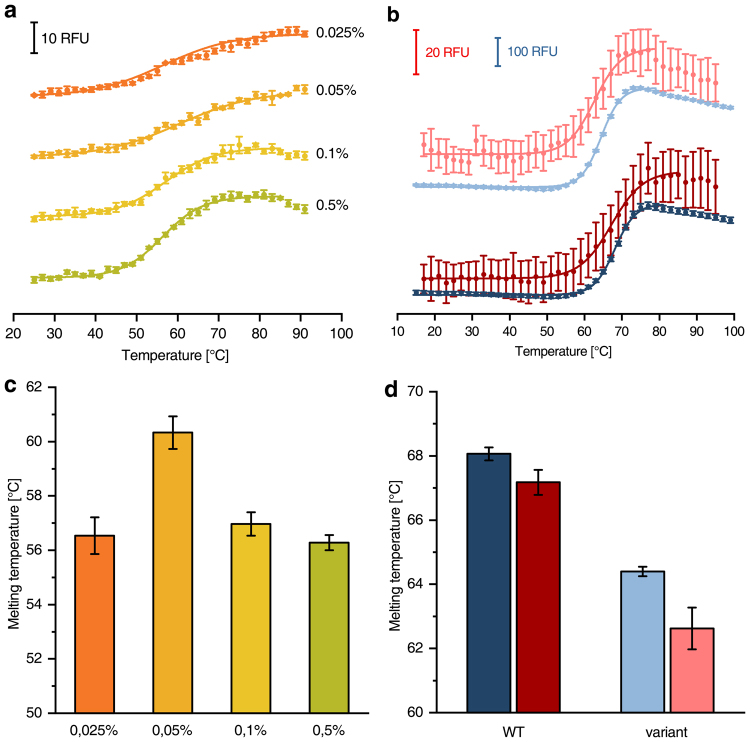
Figure 4.
Melting curves of E. coli complex I at different detergent concentrations and ThermoFAD melting curves of the wild-type enzyme and a variant. (a) CPM-fluorescence of 110 nM complex I in the presence of various DDM concentrations (ascending from orange to green). (b) ThermoFAD10 melting curves using 750 nM wild-type complex I (dark colours) or an equal amount of the V96P/N142M variant14 (light colours). The measurement was carried out with a RT-PCR machine (blue, data points recorded every 1 °C, but 2 °C steps shown for illustration purposes) and the microcontroller based device (red). (c and d) Show the melting temperatures obtained from (a) and (b), respectively.

