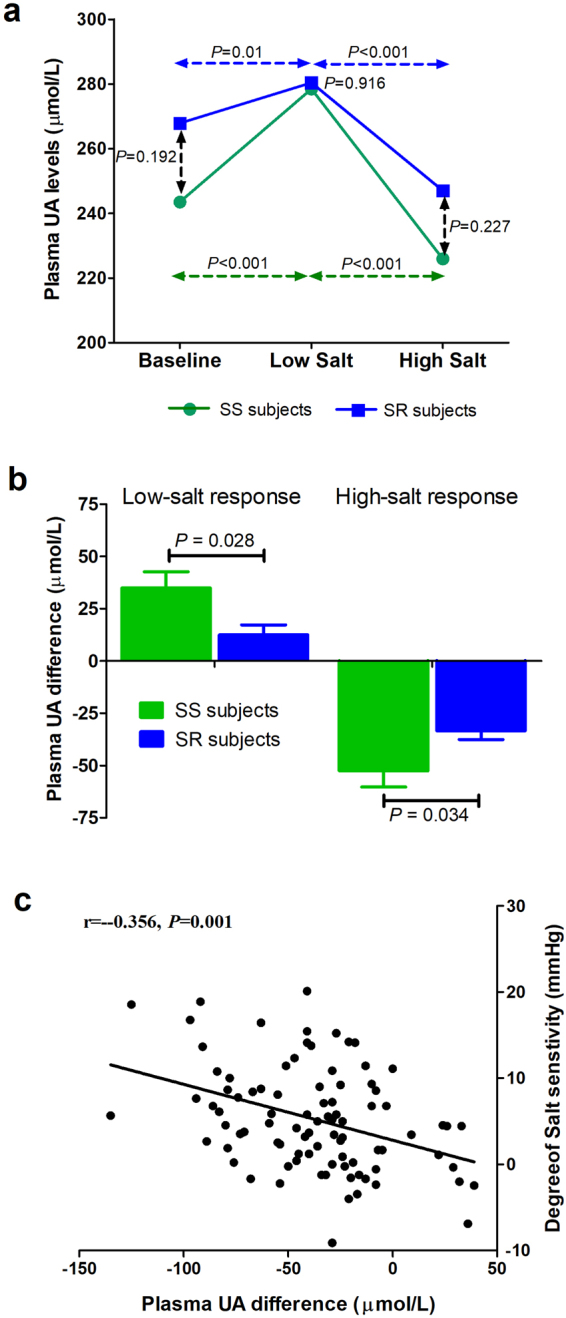
Figure 3.

(a) Comparison of plasma UA levels at baseline, low-salt and high-salt intake periods in salt-sensitive (SS) and salt-resistant (SR) subjects. Vertical dashed lines represent differences between SS and SR subjects at each of the salt intake levels. Horizontal dashed lines represent differences between salt intake levels (baseline versus low and low versus high). (b) Comparison of plasma UA responses to low-salt and high-salt diets in SS and SR subjects. (c) Correlation between plasma UA difference and degree of salt sensitivity in all subjects.
