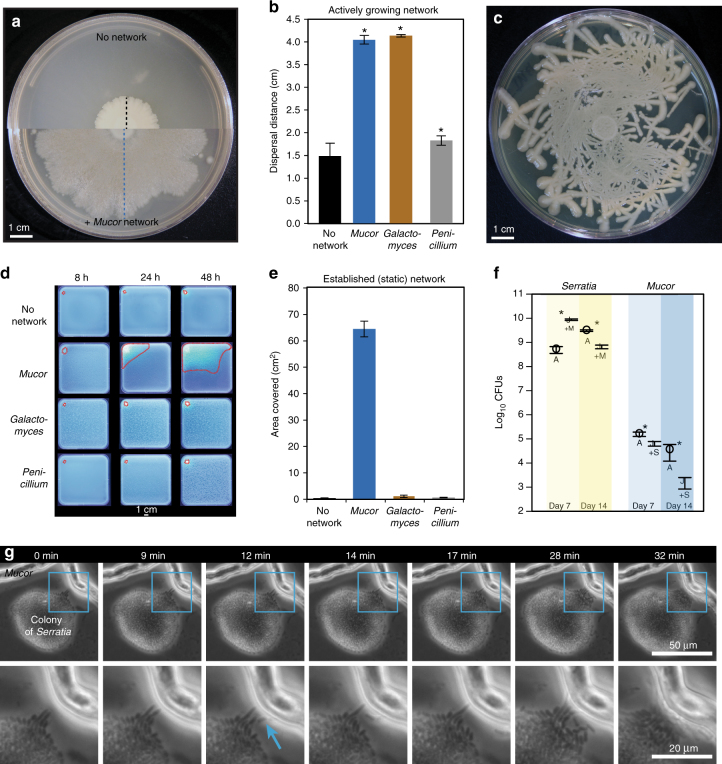
Fig. 2.
Macroscopic and microscopic characterization of Serratia proteamaculans dispersal on fungal networks. a Dispersal of Serratia on PCAMS agar without Mucor (top) and with Mucor (bottom). The black dashed line indicates dispersal distance alone and the blue dashed line indicates dispersal distance with a Mucor network (as displayed in Fig. 2b). b Serratia dispersal distance after 14 days of growth. Bars show mean distance from the center of the spot to the bacterial colony edge (±1 standard deviation, n = 5). Asterisks indicate significant differences in dispersal compared to control (Dunnett’s test, p < 0.05). c Dispersal of Serratia along a synthetic fungal network made of glass fibers placed on PCAMS agar. d Representative time-lapse images after 8, 24, and 48 hours of GFP-tagged Serratia dispersing with no network or on an already established (static) network of Mucor, Galactomyces, or Penicillium on PCAMS agar. The outermost edges of the area where Serratia spread on each fungal network are outlined in red dashed lines. Each square Petri dish is 12 cm × 12 cm. e Serratia dispersal distance with no network or on an established (static) network of Mucor, Galactomyces, or Penicillium. Bars show the mean area covered (±1 s.d., n = 3). Area traveled on Mucor was significantly higher than the other fungal networks based on an ANOVA with a Tukey’s post hoc test (F3,15 = 1788, p < 0.0001). f Serratia and Mucor growth, as measured by total colony forming units (CFUs), alone and in combination, after 7 and 14 days (n = 5). Asterisks indicate significant differences between Alone (A) and +Mucor/Serratia (+M/+S) (Student’s t-test, p < 0.05). g Time lapse of Serratia–Mucor interaction over 32 minutes. The full colony of Serratia is shown in the top row, with two Mucor hyphae at the top. The bottom row is a zoomed-in section (outlined in blue) showing a close-up of pioneer Serratia cells colonizing the Mucor hyphae, indicated by the blue arrow. See Supplementary Figure 4 for more examples

