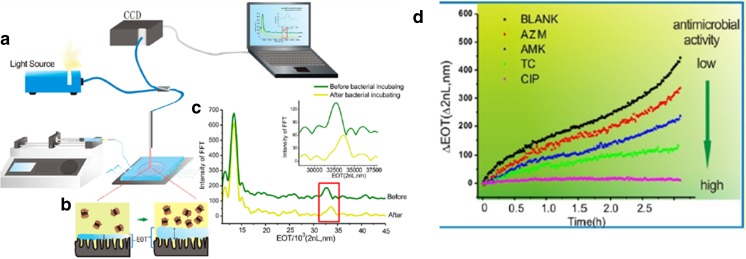
Fig. 8.
Microfluidic pH sensor. Schematic showing the experimental setup a and how the effective optical thickness (EOT) of pH-sensitive chitosan hydrogel changes as a consequence of bacterial growth b. c Fourier transform reflective interferometric spectroscopy (FT-RIFS) spectrum. The red box and inset highlight an EOT shift before and after incubation of the bacteria [78]. d EOT changes over time in E. coli cultures in the presence of different antibiotics (AZM, AMK, TC, CIP). Adapted with permission from Tang et al. [78]. Copyright (2017) American Chemical Society

