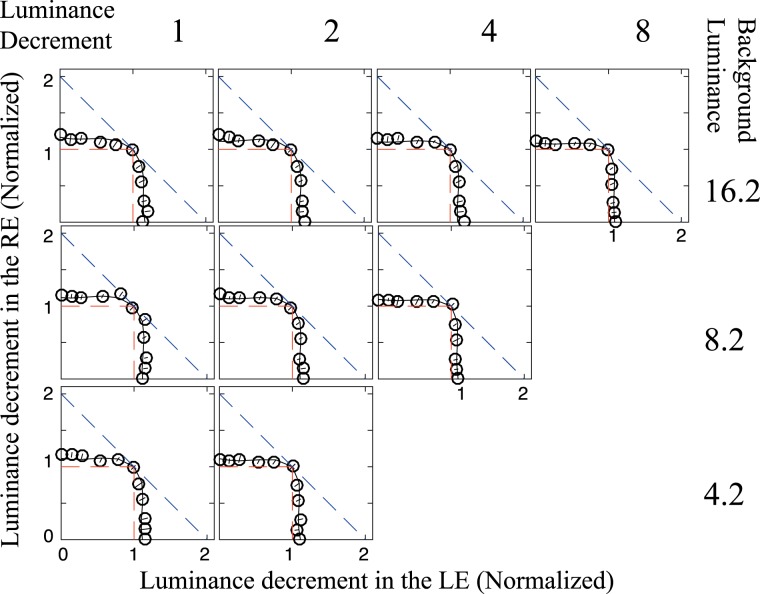
Figure 4.
Equal-luminance-decrement contours. The test luminance decrement from the background (cd/m2, as indicated in the right numbers) was matched to that of the standard luminance decrement (cd/m2, as indicated in the top numbers). For example, for the panel in the first column and second row, the background luminance is 8.2 cd/m2 and the standard luminance decrement is 1 cd/m2 (e.g., the disc standard luminance is 7.2 cd/m2). The black curves are fits of the full model shown in Figure 2. The red dashed lines show the predictions of the winner-take-all model, and the blue dashed lines shows the predictions of the linear summation model.

