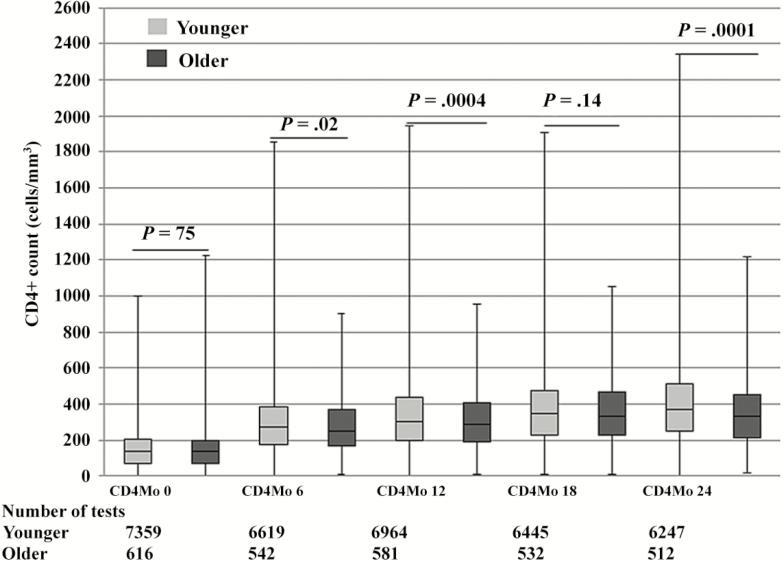
Figure 2.
Box plot of median CD4+ counts from baseline (Mo) through 24 months by age group. The box plot used minimum value (lower error bar), the the 25th percentile (lower border of the box), the median value/50th percentile (the line in the middle of the box), the 75th percentile (the top border of the box), and the maximum value (the top error bar).

