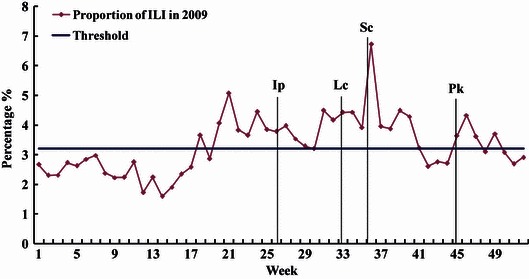
Figure 4.

Detection of influenza epidemic by control chart method based on the surveillance data of influenza‐like illness (ILI) during 2004 to 2008 in Wuxi, People’s Republic of China. The threshold was calibrated as the average weekly proportion of ILI + 2Sp (3·2%). Weekly ILI% is calculated as the weekly counts of ILI to total patient visits. The occurrence of each important epidemic event is marked by a vertical line. Legend: Ip, the first imported influenza A (H1N1) case; Lc, the first local influenza A (H1N1) case; Sc, the outbreak of influenza A (H1N1) in school; Pk, the epidemic peak of influenza A (H1N1) in general population.
