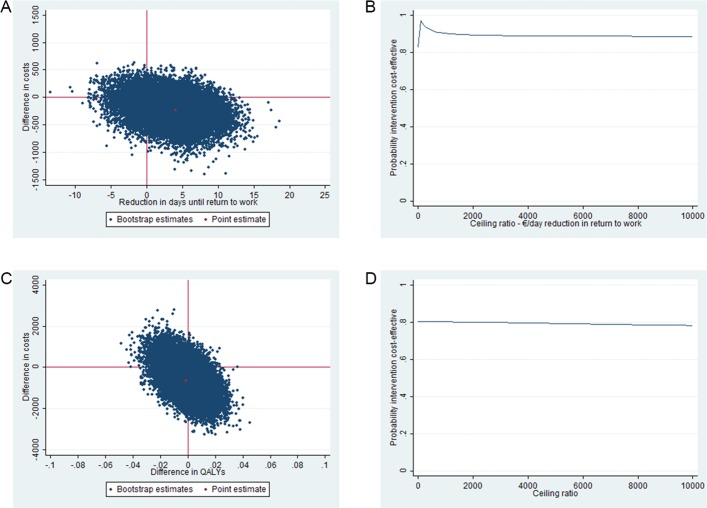
Figure 2.
CE planes and CEA curves for RTW and QALYs. The CE planes indicate the uncertainty around the incremental cost-effectiveness ratio for RTW (A) and QALYs (C). The CEA curves indicate the probability of cost-effectiveness for different values (€) of willingness-to-pay per unit of effect gained for RTW (B) and QALYs (D). CE, cost-effectiveness; CEA, cost-effectiveness acceptability; QALY, quality-adjusted life year; RTW, return to work.

