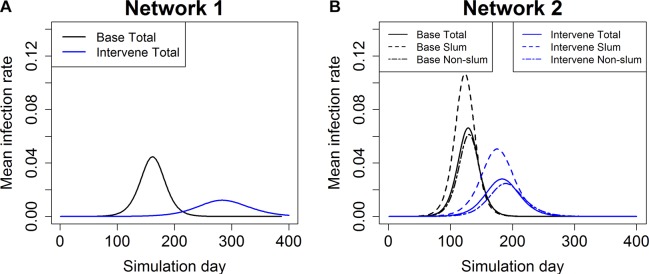
Figure 1.
Epidemic curves for base case and vaccination case in (A) network 1 and (B) network 2. Each timepoint in the curve is an average over 25 replicates. The vaccines are given randomly to 30% of the entire population and the vaccine efficacy is 30%. For network 2, epidemic curves are shown for total population and slum and non-slum subpopulations. ‘Intervene Total’ refers to the epidemic curve of the entire Delhi population when the vaccine intervention is applied. ‘Intervene Slum’ refers to the epidemic curve for just the slum population, and ‘Intervene Non-slum’ refers to the epidemic curve for just the non-slum population for the intervention case. Epidemic curves for a variety of compliances and efficacies are reported in online supplementary figures 1 and 2. (A) Total Delhi network 1 and (B) Total Delhi network 2.

