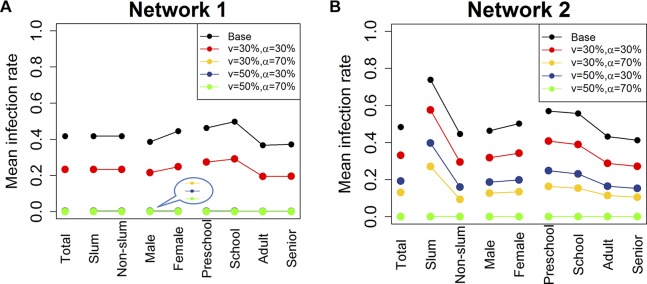
Figure 2.
Mean cumulative infection rates for different subgroups in the two networks. Two vaccination rates (v=30%, 50%) and two vaccine efficacy rates (α=30%, 70%) are considered. Individuals are chosen at random in the entire network for vaccination on day 0. Mean infection rates are calculated within each group. The last several lines in the plot for network 1 are overlapping at the bottom because the mean infection rates are almost 0 under those scenarios. ‘Total’ refers to the entire population of Delhi. ‘Slum’ and ‘Non-slum’ refer to slum and non-slum regions, respectively. ‘Male’ and ‘Female’ denote the total number of men and women in Delhi, respectively. Age groups are denoted by ‘Preschool’, ‘School’, ‘Adult’ and ‘Senior’. (A) Total Delhi network 1 and (B) Total Delhi network 2.

