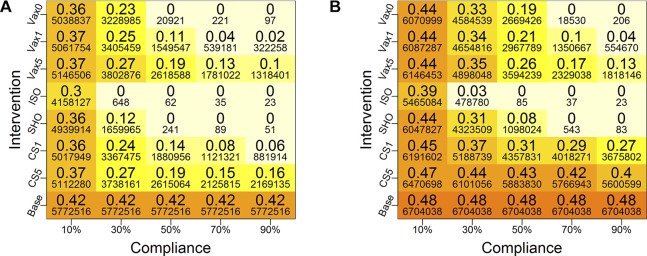
Figure 3.
Mean cumulative infection rates under different interventions for (A) network 1 and (B) network 2. The larger font numbers are fractions of populations that are infected and the smaller font numbers are counts of infected individuals. Colours of the boxes correspond to the values of the large numbers (ie, fractions of infected), and the same scheme is used for both plots for comparisons—and for all plots in this paper. Five different compliance rates are examined (10%, 30%, 50%, 70% and 90%), and four types of intervention strategies (vaccination (VAX), close-schools (CS), stay-home (SHO) and isolation (ISO)) are considered. For vaccines, three different trigger points are considered: when the cumulative infection rate reaches 0% (VAX0), 1% (VAX1) and 5% (VAX5) of the total population. The vaccine efficacy is set at 30%. For CS, two trigger points are used: when cumulative infection rate reaches 1% (CS1) and 5% (CS5). Compliant individuals are selected at random from the entire Delhi population, and the cumulative infection rates are calculated for each network. Base is the baseline case with no interventions. (A) Total Delhi network 1 and (B) Total Delhi network 2.

