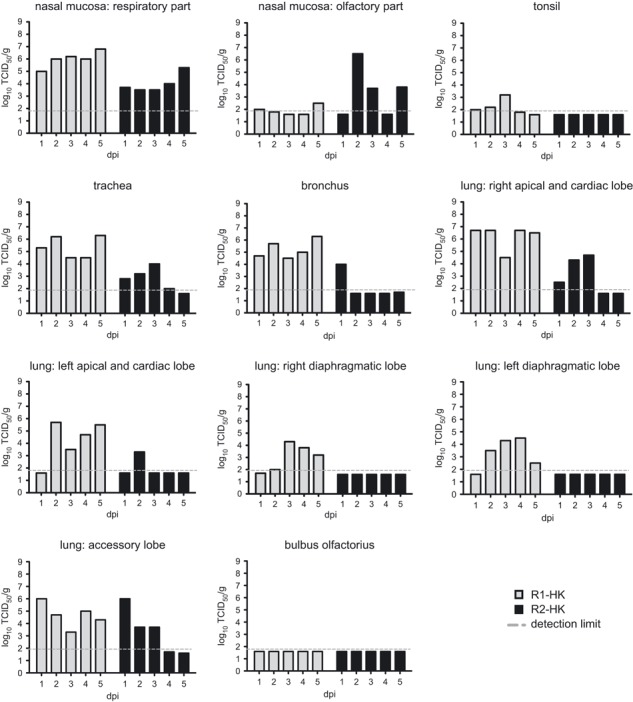
Figure 3.

Replication of R1‐HK (gray bars) and R2‐HK (black bars) influenza virus in various parts of the respiratory tract and in the bulbus olfactorius of pigs during five subsequent days post inoculation. Each bar represents the virus titer of an individual pig. The thin dashed line represents the detection limit.
