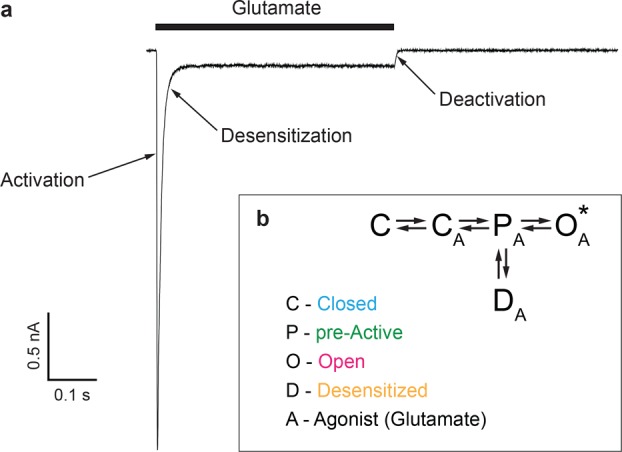
Figure 2.

Functional recording and kinetic model of iGluR gating. (a) Representative whole-cell patch-clamp current recorded at a −60 mV membrane potential from a HEK-293 cell expressing GluA2 in response to a 0.5 s application of the agonist glutamate (black bar). Current components that are mainly determined by the three major gating processes, activation, desensitization, and deactivation, are indicated by arrows. (b) Simplified kinetic model of iGluR gating, with closed (C), pre-active (P), open (O), and desensitized (D) states. The agonist-bound states are indicated by “A”, and the conducting state is indicated by an asterisk. Colors associated with each state C (blue), P (green), O (magenta), and D (orange) are used throughout this Perspective for structural representations.
