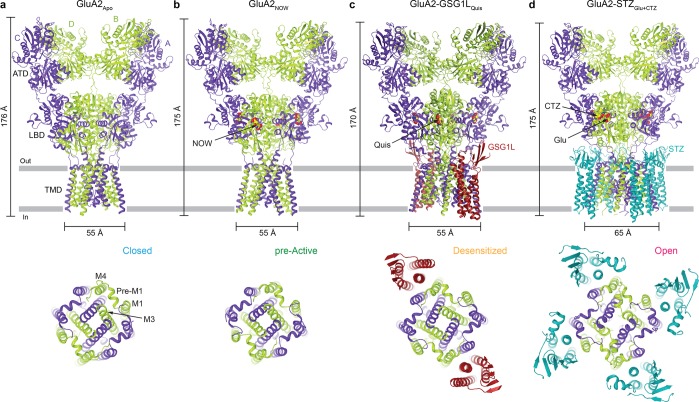
Figure 3.
Structures of AMPARs and AMPAR complexes representing different gating conformations. Shown are the entire structures viewed parallel to the membrane (top row) or their TMDs viewed extracellularly (bottom row). (a) Crystal structure of GluA2 in the absence of ligands, GluA2Apo (PDB entry 5L1B), representing the resting, closed state (C). (b) Crystal structure of GluA2 bound to the partial agonist nitrowillardiine (NOW), GluA2NOW (PDB entry 4U4F), representing the pre-active state (P). (c) Cryo-EM structure of the GluA2–GSG1L complex bound to the full agonist quisqualate (Quis), GluA2–GSG1LQuis (PDB entry 5VHZ), representing the desensitized state (D). (d) Cryo-EM structure of the GluA2–STZ complex bound to the full agonist glutamate (Glu) and positive allosteric modulator cyclothiazide (CTZ), GluA2–STZGlu+CTZ (PDB entry 5WEO), representing the open state (O). All ligands are shown as space-filling models. AMPAR subunits are colored purple (A and C) and green (B and D), with auxiliary subunits colored red (GSG1L) or blue (STZ).

