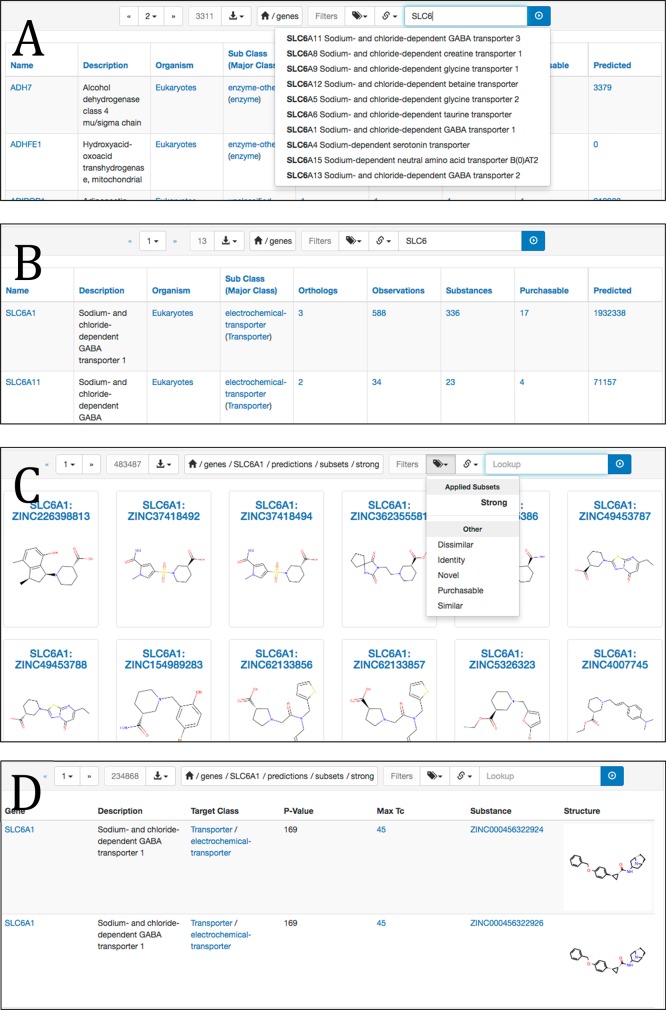
Figure 3.
Tools to display predictions for a gene and filter and sort them by MaxTc and pSEA. (A) Gene page showing predictions, with search bar to locate genes by name, top right. https://zinc15.docking.org/genes. (B) Gene listings for genes matching “SLC6” https://zinc15.docking.org/genes/search?q=SLC6. (C) Strongly predicted ligands for SLC6A11, showing the popup for subset selections https://zinc15.docking.org/genes/SLC6A11/predictions/subsets/strong. (D) Individual predictions, showing MaxTc and pSEA for each prediction, sorted by pSEA, with a MaxTc (novelty/similarity) limit specified https://zinc15.docking.org/genes/SLC6A1/predictions/subsets/strong/table.html?sort=-pvalue&maxtc-between=40+45.

