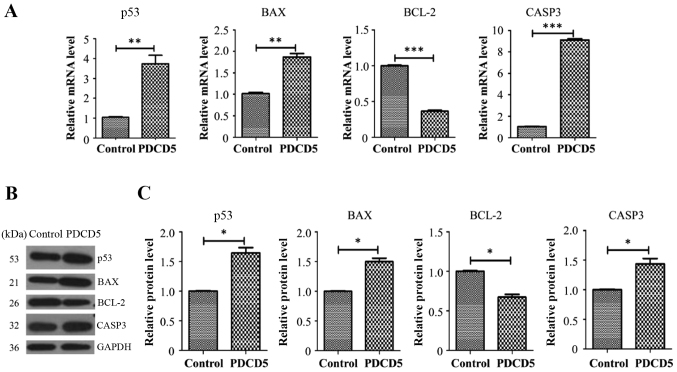
Figure 5.
P53, BAX and CASP3 are upregulated while BCL-2 is downregulated in the PDCD5 overexpressing A431 cells. (A) The transcript levels of P53, BAX, BCL-2 and CASP3 in the PDCD5 overexpressing A431 cells and its control cells were analyzed by real-time RT-PCR. (B) The expression levels of P53, BAX, BCL-2 and CASP3 in the PDCD5 overexpressing A431 cells and its control cells were examined by western blot. GAPDH was used as a loading control. (C) Quantification for western blot data in (B) from there independent experiments. *P<0.05, **P<0.01 and ***P<0.001. Control, empty vector-transfected A431 cells; PDCD5, PDCD5 overexpressing A431 cells.

