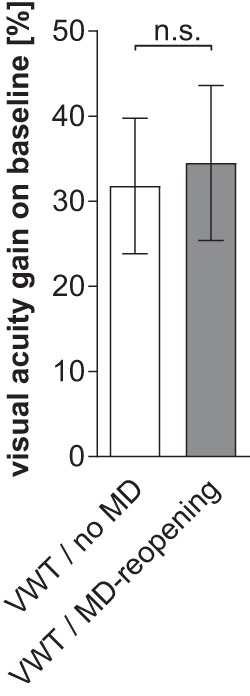
Figure 5.

VA increase after long-term VWT training. A, Gain on baseline (%) of long-term VA of the VWT/no-MD (left, n = 5) and VWT/MD-reopening (sub)group (MD, right, n = 6). Values are represented as mean ± SEM. Statistical significance was tested by a two-tailed unpaired t test.
