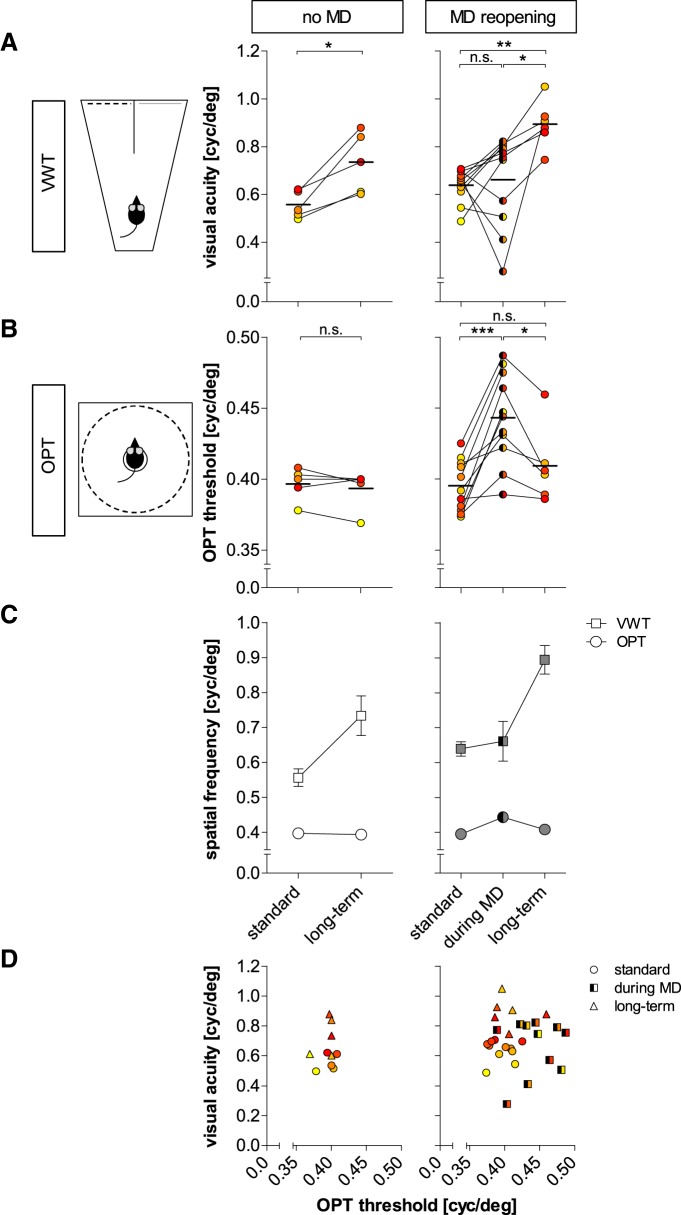
Figure 6.
VWT and OPT thresholds of individual mice develop differently. Quantitative comparison of VWT-determined VA (A) and OPT thresholds (B) in individual animals of the VWT/no-MD group (n = 5) before (standard) and after long-term VWT training (left column) and in the VWT/MD group before (standard, n = 11), during (n = 11), and after MD (long-term, VWT/MD-reopening, n = 6/11; right column). The color code indicates low initial standard VA values in yellowish, higher values in reddish colors. A, VA (cyc/deg), determined by VWT. B, Spatial frequency threshold of the OPT reflex (OPT threshold, cyc/deg). A, B, Statistical significance was tested by two-tailed paired t tests; *p < 0.05; **p < 0.01; ***p < 0.001. C, Average VA and OPT thresholds. Values are represented as mean ± SEM (D) VA plotted against OPT thresholds of individual mice.

